Ticker: ROK
Price: 361.20 USD
Target: 430 USD
Closed: 430 USD
Company Overview
Rockwell Automation is a global provider of industrial automation and digital transformation solutions, serving manufacturing customers across North America, Europe, the Middle East, Africa, Asia-Pacific and Latin America. Founded in 1903 and headquartered in Milwaukee, Wisconsin, the company develops hardware, software and integrated solutions designed to improve productivity, efficiency and operational visibility in industrial environments.
Rockwell’s solutions span the full industrial automation stack, including programmable controllers, motion systems, industrial drives, sensing and safety components, as well as manufacturing software, digital twin technologies and advanced analytics platforms. In addition to its product offering, the company provides a broad suite of services such as digital consulting, cybersecurity, asset optimization, remote monitoring and lifecycle support.
The company distributes its products primarily through a combination of direct sales and a global network of independent distributors, allowing it to maintain deep penetration across a wide range of industrial end markets.
Rockwell’s industrial exposure can be viewed through two distinct lenses. From a commercial standpoint, the company serves a diversified set of end markets across discrete, hybrid and process industries, which helps explain the breadth of its automation footprint across manufacturing. From a financial reporting standpoint, however, Rockwell is not managed or disclosed by end market, but through three operating segments that reflect where value is created across the automation stack: Intelligent Devices, Software & Control, and Lifecycle Services.
This distinction is important for the investment case. End-market exposure helps frame cyclicality, customer demand patterns and capital spending sensitivity, whereas the segment structure is the relevant framework to assess revenue mix, margin formation and the company’s ongoing transition from a predominantly hardware-centric automation supplier toward a more integrated model combining hardware, software and recurring services. In other words, while customer demand originates in manufacturing verticals, Rockwell’s economic profile is ultimately determined by the relative weight and profitability of its three core business lines.
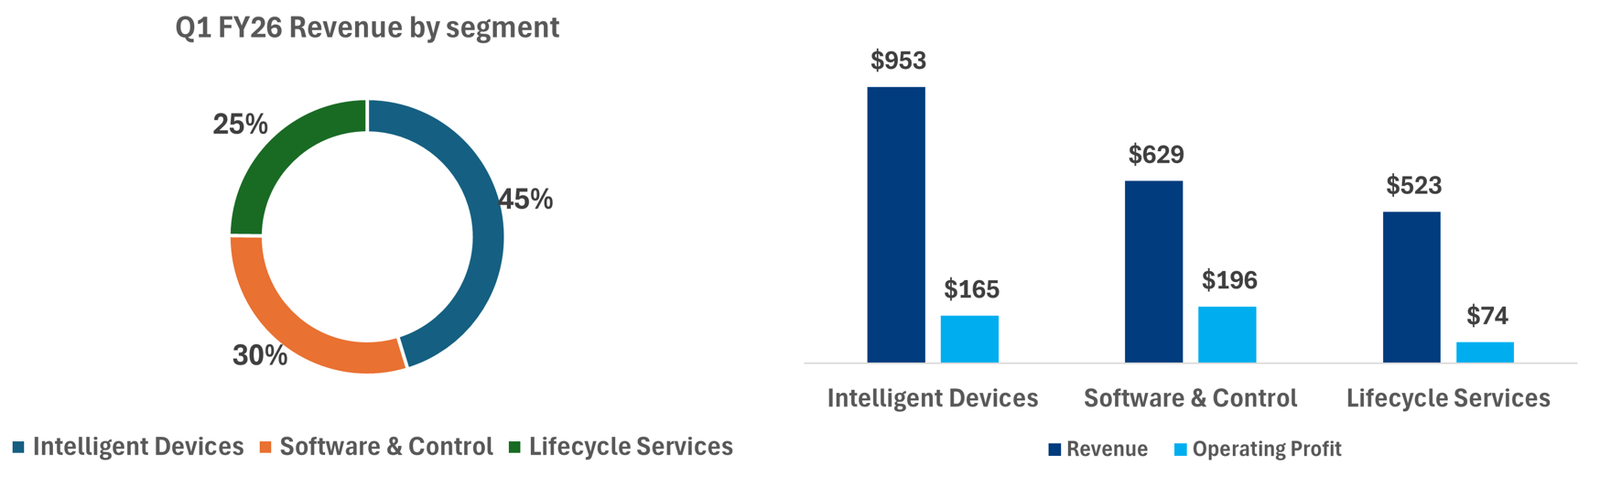
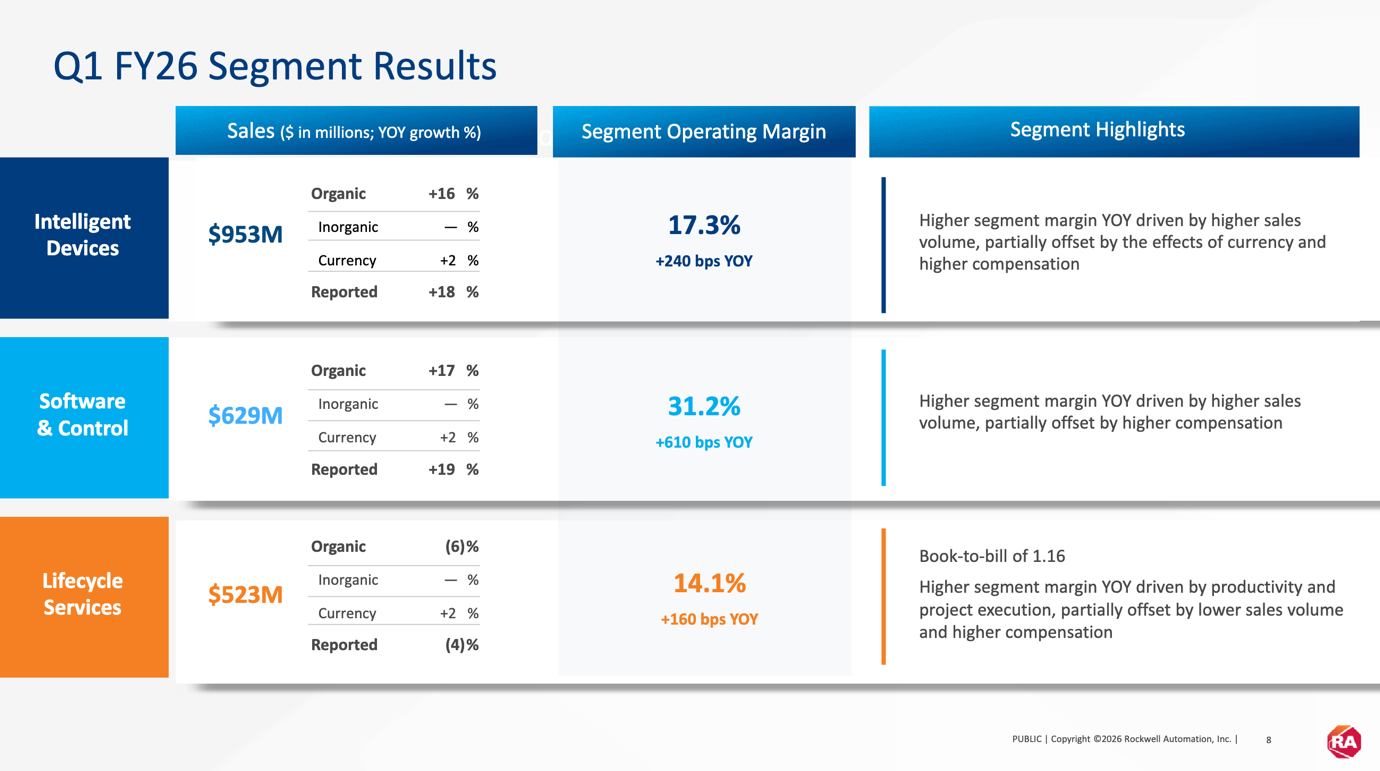
Rockwell reported Q1 FY26 revenue across the three segments as follows: Intelligent Devices $953 million, Software & Control $629 million, and Lifecycle Services $523 million, corresponding to roughly 45%, 30% and 25% of group revenue, respectively. Segment operating margins were 17.3%, 31.2%, and 14.1%, highlighting the markedly higher profitability of the software layer relative to the more hardware- and project-intensive parts of the portfolio.
Against this backdrop, the most useful way to frame Rockwell’s business model is to analyze each division separately, as each one plays a different role in the value chain: Intelligent Devices provides the installed hardware base, Software & Control captures the higher-value digital and control layer, and Lifecycle Services extends the relationship through integration, support, cybersecurity and recurring service revenues.
Together, these segments form an increasingly integrated automation platform rather than a pure-play hardware vendor.
Business Lines
Rockwell Automation’s business model is best understood through its three operating segments, each of which addresses a different layer of the industrial automation stack and carries a distinct economic profile. At a high level, the company is no longer a pure hardware vendor: it now combines physical automation products, control and software platforms, and lifecycle-oriented services, allowing it to participate across the full design, deployment and optimization cycle of factory automation.
- Intelligent Devices (45% of Q1 FY26 revenues and 38% of EBIT) represents Rockwell’s most hardware-centric business and forms the physical execution layer of the automation architecture. This segment includes products such as drives, motion systems, advanced material handling solutions, safety devices, sensing technologies, industrial components and configured-to-order hardware. In practical terms, this is the part of the portfolio that directly interacts with machines, motors, conveyors, robotic cells and production lines on the factory floor. It is therefore the segment most exposed to short-cycle industrial demand and customer capital spending in areas such as packaging, warehouse automation, automotive and general manufacturing. From a profitability standpoint, Intelligent Devices generated a 17.3% segment operating margin in Q1 FY26, up 240bps year-on-year, with margin expansion driven primarily by higher sales volumes, partially offset by currency effects and higher compensation. Economically, this is a solid but more cyclical business, with margins supported by scale, installed base and product mix, but structurally lower than software because of its higher manufacturing and supply-chain content.
- Software & Control (30% of Q1 FY26 revenues and 45% of EBIT) is the highest-value layer of the portfolio and the clearest expression of Rockwell’s transition toward a more digital and software-enabled automation model. This segment includes control and visualization software and hardware, digital twin and simulation tools, information software, network and security infrastructure, and custom-engineered control systems. It is also the segment through which Rockwell monetizes much of its higher-value intellectual property, including platforms used to design, simulate, monitor and optimize production environments. Operationally, this business sits at the intersection of machine control, software orchestration and industrial data visibility: it enables customers not only to automate a process, but also to model it, manage it, troubleshoot it and improve it over time. The segment delivered $629 million of revenue in Q1 FY26, with a 31.2% segment operating margin, making it by far the most profitable business line in the group. The margin premium reflects the inherently more scalable economics of software, the contribution from recurring software revenues, and a more favorable gross-margin structure relative to hardware-heavy operations. As such, Software & Control is the key driver of mix improvement and one of the most important contributors to Rockwell’s long-term quality re-rating.
- Lifecycle Services (25% of Q1 FY26 revenues and 17% of EBIT) captures the post-sale and solution-oriented part of the customer relationship and extends Rockwell’s role well beyond product supply. This business includes digital consulting, professional services, engineered-to-order solutions, recurring services, industrial cybersecurity, remote monitoring, repair and technical support, asset management and optimization consulting, training, and spare parts. In practice, Lifecycle Services is the layer that helps customers implement, maintain, secure and continuously improve their installed automation base. It is strategically important because it deepens customer integration, increases switching costs and supports the expansion of recurring revenue streams, particularly in areas such as cybersecurity and remote services. Financially, however, it is also the most labor- and project-intensive segment, which explains its lower profitability profile relative to software. In Q1 FY26, Lifecycle Services reported $523 million of revenue, with a 14.1% segment operating margin, supported by productivity actions and improved project execution despite lower sales volume. The segment also posted a book-to-bill ratio of 1.16, suggesting that orders ran ahead of revenue recognition during the quarter and that part of the current weakness may reflect timing rather than structural deterioration.
Industrial Analysis
The industrial automation sector is benefiting from a broad structural shift in global manufacturing toward higher productivity, tighter process control, better quality consistency and greater operating resilience. Across end markets, manufacturers are investing in automation not only to reduce direct labor intensity, but also to improve throughput, lower downtime, increase traceability and optimize energy and asset utilization in increasingly complex production environments. This trend is no longer confined to traditional robotics-heavy industries such as automotive and electronics; it is progressively extending into food and beverage, logistics, general industry and process manufacturing as the economics of sensing, motion, controls, industrial networking and software continue to improve.
What is changing within the sector is not just the volume of automation deployed, but the composition of value creation. Industrial automation is increasingly evolving from a hardware-centered market into a broader smart manufacturing ecosystem built around connected devices, industrial software, cloud and edge computing, analytics, digital twins, cybersecurity and AI-enabled optimization.
At the same time, the rise of AI introduces an important strategic nuance for the sector. On the one hand, AI is clearly reinforcing demand for automation software, digital twins, analytics, intuitive interfaces and workflow simplification. On the other hand, it cannot be ignored that, over time, AI could also become a competitive threat if more generalized software layers or hyperscaler-led tools were to commoditize part of the orchestration and decision layer sitting above the physical automation stack. At this stage, however, Rockwell’s own commentary does not point in that direction. In both the Q4 FY25 and Q1 FY26 quarterly discussions, management framed AI primarily as an enabling layer that enhances the value of its software and services rather than as a source of disruption for Software & Control or Lifecycle Services.
In the latest call, management explicitly emphasized that AI should “fortify and complement the existing system” and described the “real prize” as the simplification of automation and digital transformation on the plant floor, suggesting that, at least for now, AI is being positioned more as a product enhancement and share-gain opportunity than as a near-term disintermediation risk.
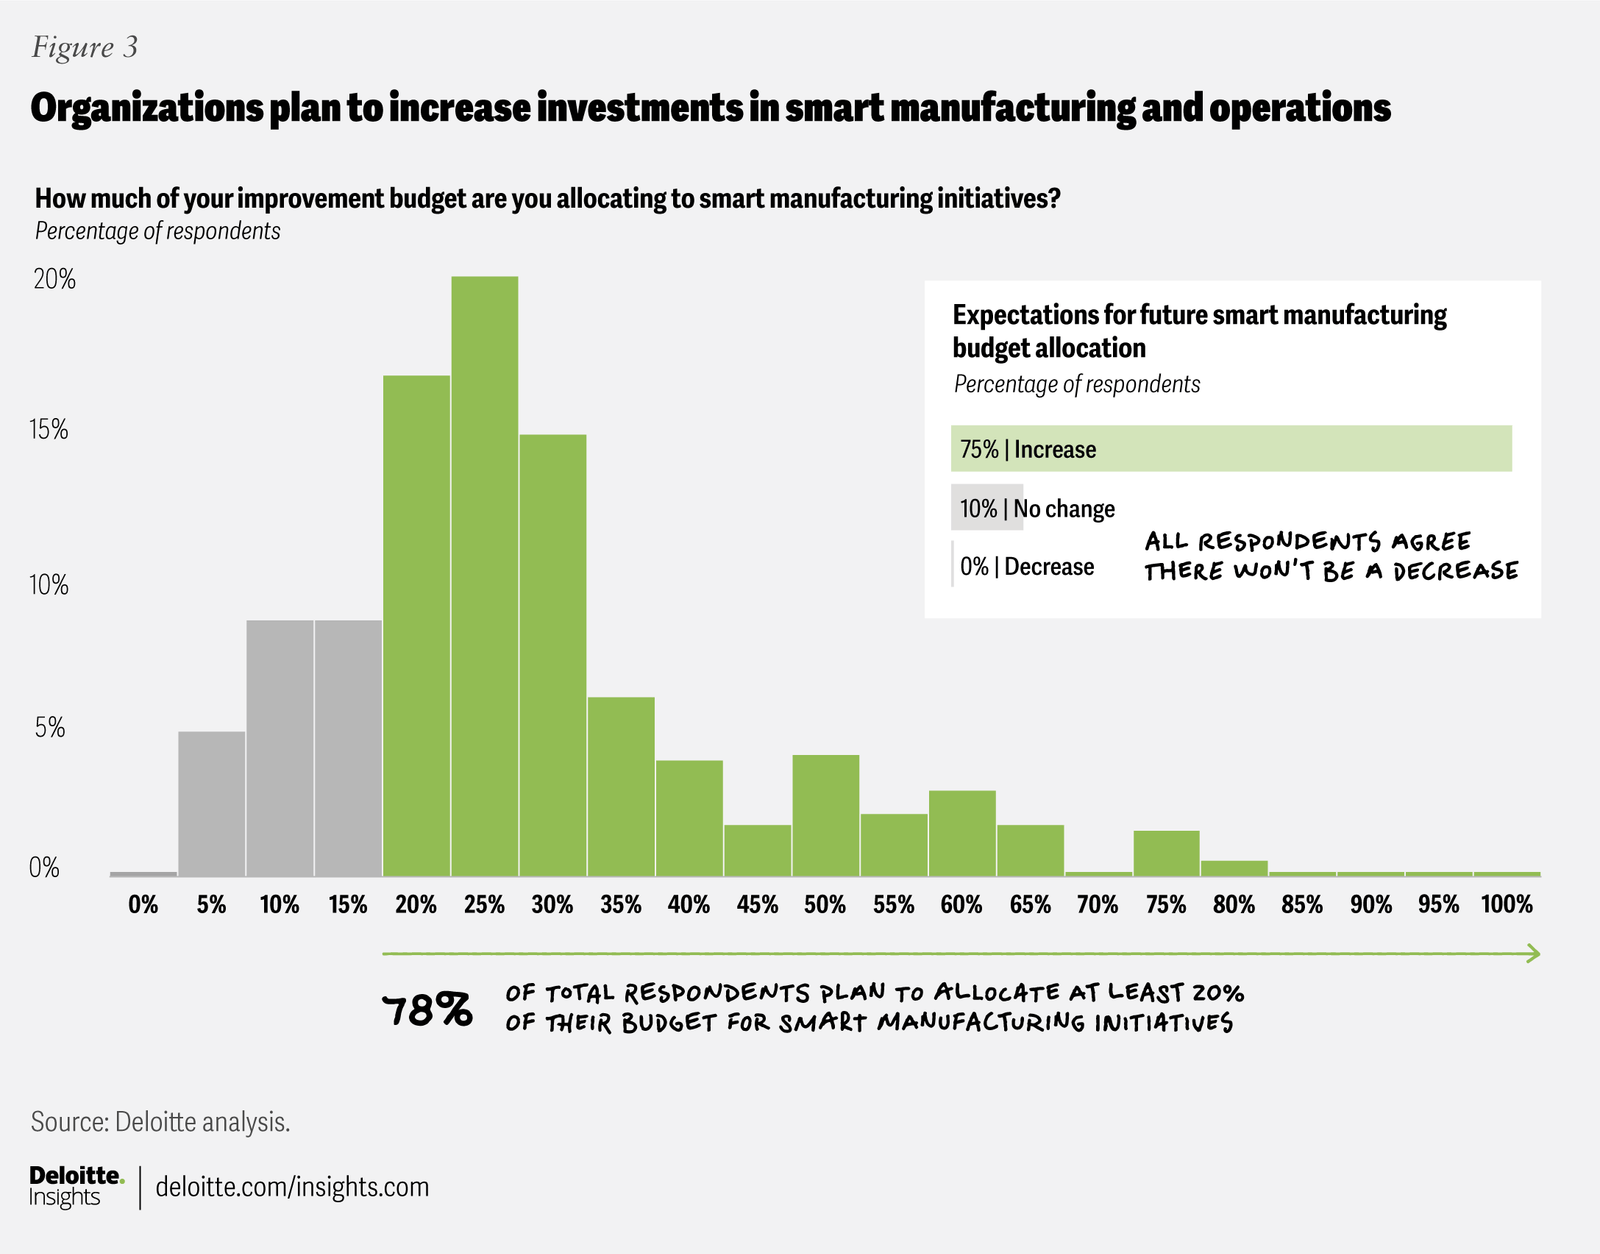
Deloitte’s 2025 smart manufacturing survey shows that adoption is already moving well beyond pilot programs: 92% of surveyed manufacturers believe smart manufacturing will be a main driver of competitiveness over the next three years, and 78% are allocating more than 20% of their overall improvement budgets to smart manufacturing initiatives, including data analytics, sensors, cloud and AI. In parallel, adoption rates are already meaningful across enabling technologies such as cloud computing, analytics, industrial IoT and 5G. The implication for the sector is clear: the physical automation layer remains essential, but an increasing share of customer value and strategic differentiation is shifting toward the software, data and orchestration layer that sits on top of it.
A particularly important demand driver is the manufacturing skills gap, which is increasingly supporting spending on automation software, intuitive interfaces and AI-assisted tools, not just on machines and controllers.
The sector is facing a labor constraint that is both quantitative and qualitative: manufacturers need more workers, but they also need workers capable of operating more digital, data-rich and software-intensive production systems. Deloitte’s survey notes that manufacturers may require as many as 3.8 million net new employees by 2033, while also highlighting that human capital and workforce remain among the least mature areas of smart manufacturing transformation.
In that context, software is becoming part of the labor solution: manufacturers increasingly value tools that simplify programming, standardize workflows, embed expert knowledge into the interface, shorten training cycles and reduce dependence on scarce high-skill operators. In practical terms, this means the sector is selling not only automation capacity, but also usability, abstraction and operational simplification.
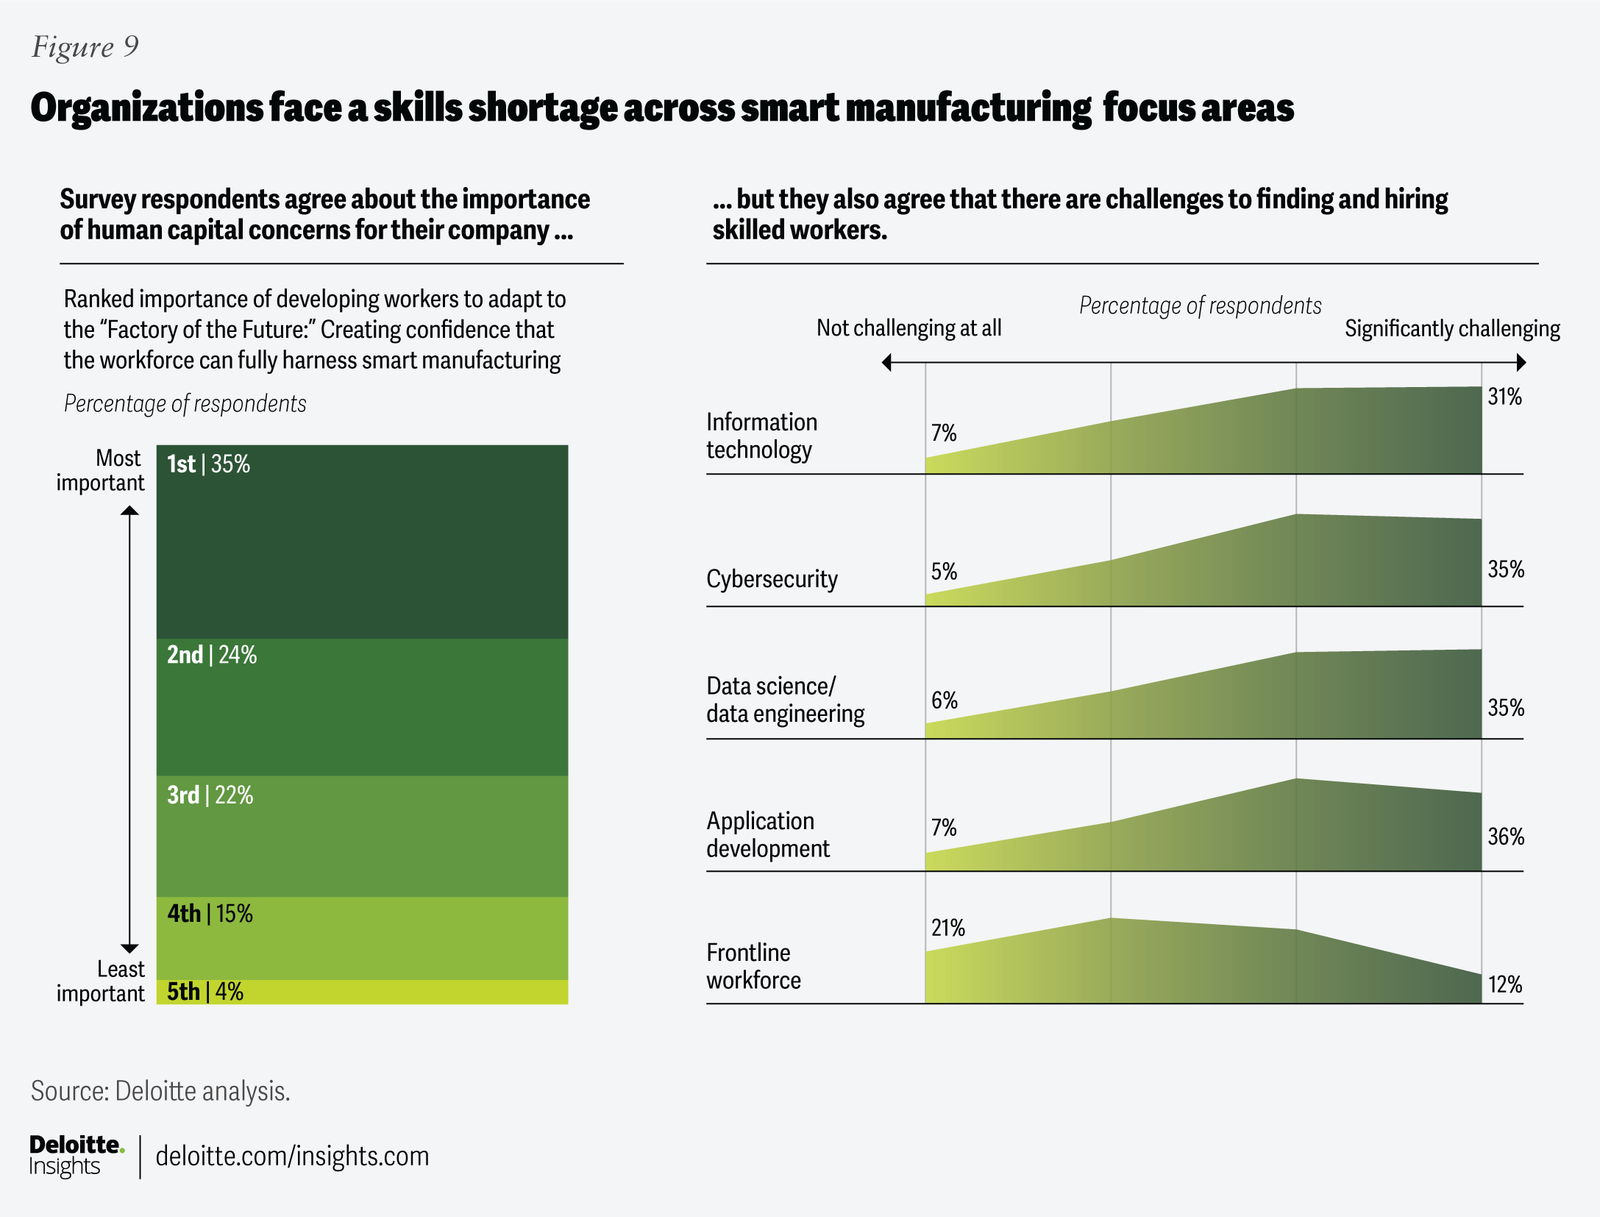
The more difficult it becomes to hire and retain highly specialized factory labor, the greater the incentive to adopt software layers that make advanced automation easier to deploy, monitor and troubleshoot at scale.
Despite these structural tailwinds, the industrial automation sector faces a complex matrix of cyclical and operational headwinds. As illustrated in the chart below, manufacturers are currently navigating a “triple threat” of challenges: geopolitical uncertainty (led by trade and tariff volatility), cost pressures (specifically raw material inflation), and operational constraints (labor scarcity and residual supply-chain friction).
These factors create a cautious capital-spending environment. While the long-term investment thesis for automation remains intact, near-term project cycles are increasingly sensitive to macro volatility. In this context, manufacturers often choose to delay or rescale large-scale modernization until there is greater clarity on trade policies and input cost stability.
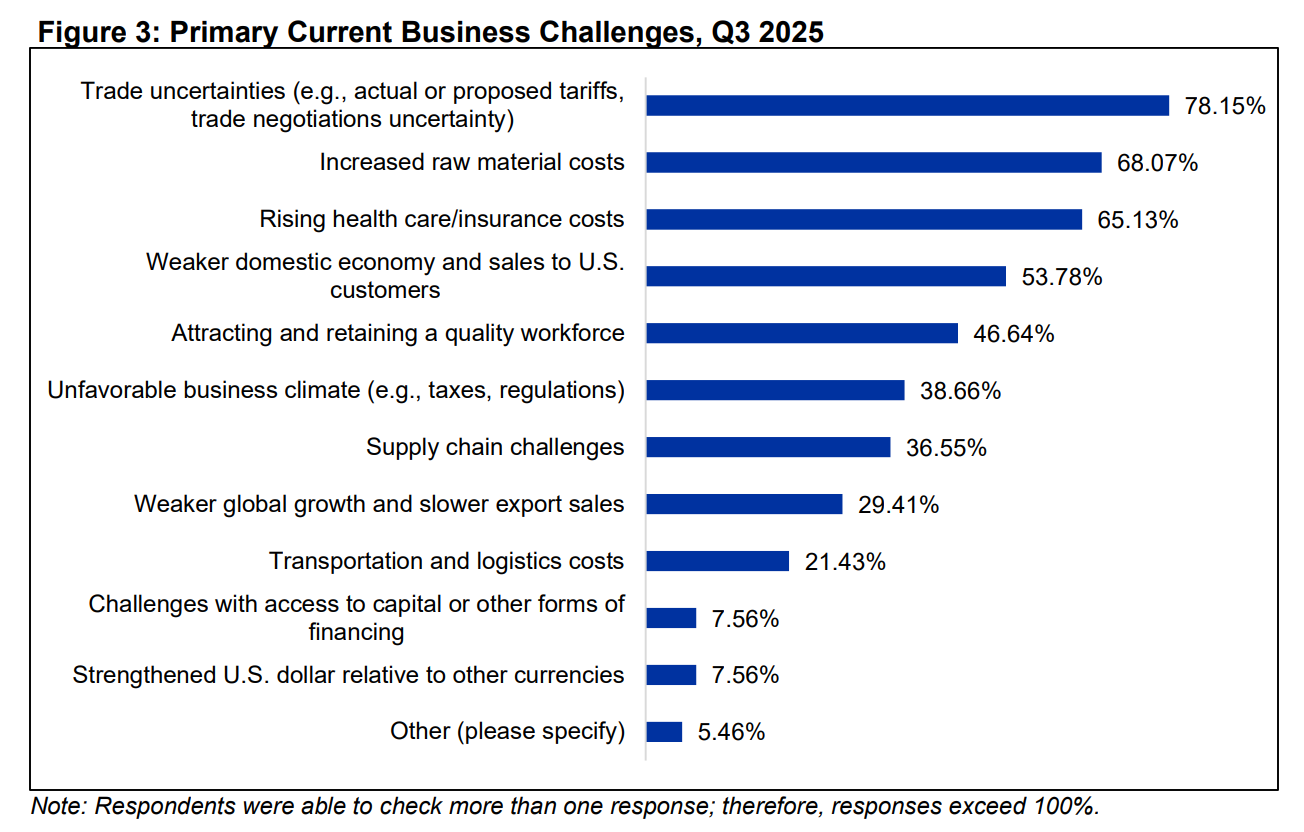
Beyond these broader industry headwinds, the sector is also exposed to more specific execution risks linked to the nature of automation projects themselves. Many companies in the space combine short-cycle product sales with longer-cycle engineered systems, software implementations and multi-quarter service contracts. This mix can create working-capital volatility, as vendors may need to procure components ahead of delivery, carry inventory through uncertain lead times, and absorb timing mismatches between costs incurred, milestone billing and final customer acceptance. These execution risks become even more relevant when inflation or tariff volatility affects longer-duration projects and contractual repricing mechanisms lag the underlying increase in input costs.
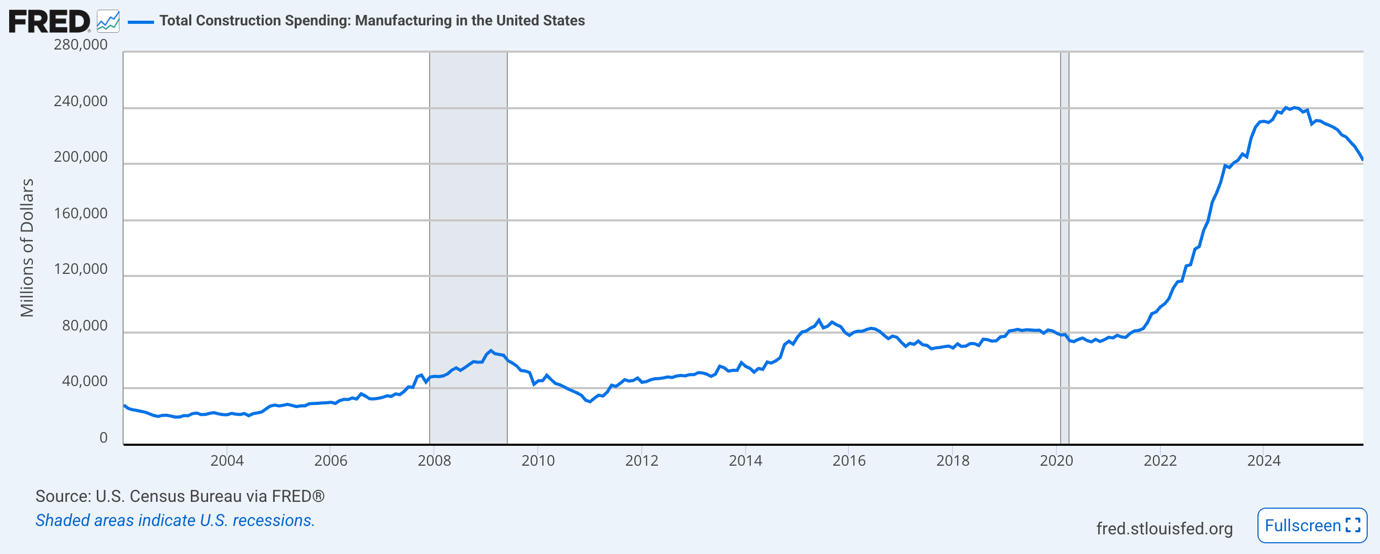
Another important industry tailwind is the ongoing reshoring and reindustrialization of U.S. manufacturing. In 2025, U.S. trade policy continued to frame tariffs and related trade measures as instruments to reinforce domestic industrial capacity and stimulate local investment. For the automation sector, the implication is straightforward: a larger U.S. manufacturing footprint generally requires additional factory-level controls, drives, motion systems, software, safety infrastructure and plant digitalization. This trend is visible not only in policy direction, but also in actual capacity announcements. In March 2025, TSMC announced plans to expand its total U.S. investment to $165 billion, including three new fabrication plants, two advanced packaging facilities and an R&D center in Arizona. More broadly, U.S. manufacturing construction spending has moderated from the 2024 peak, but remained elevated at a seasonally adjusted annual rate of $202.4 billion in December 2025, suggesting normalization from exceptionally high levels rather than a reversal of the domestic industrial build-out.
The reshoring theme should still be framed with nuance rather than as a straight-line benefit: tariff policy can support local capacity additions, but it can also raise input costs, complicate sourcing decisions and delay project timing while manufacturers reassess supply-chain footprints and return thresholds. Even so, at the sector level, the medium-term direction of travel remains supportive for automation demand.
Market Positioning
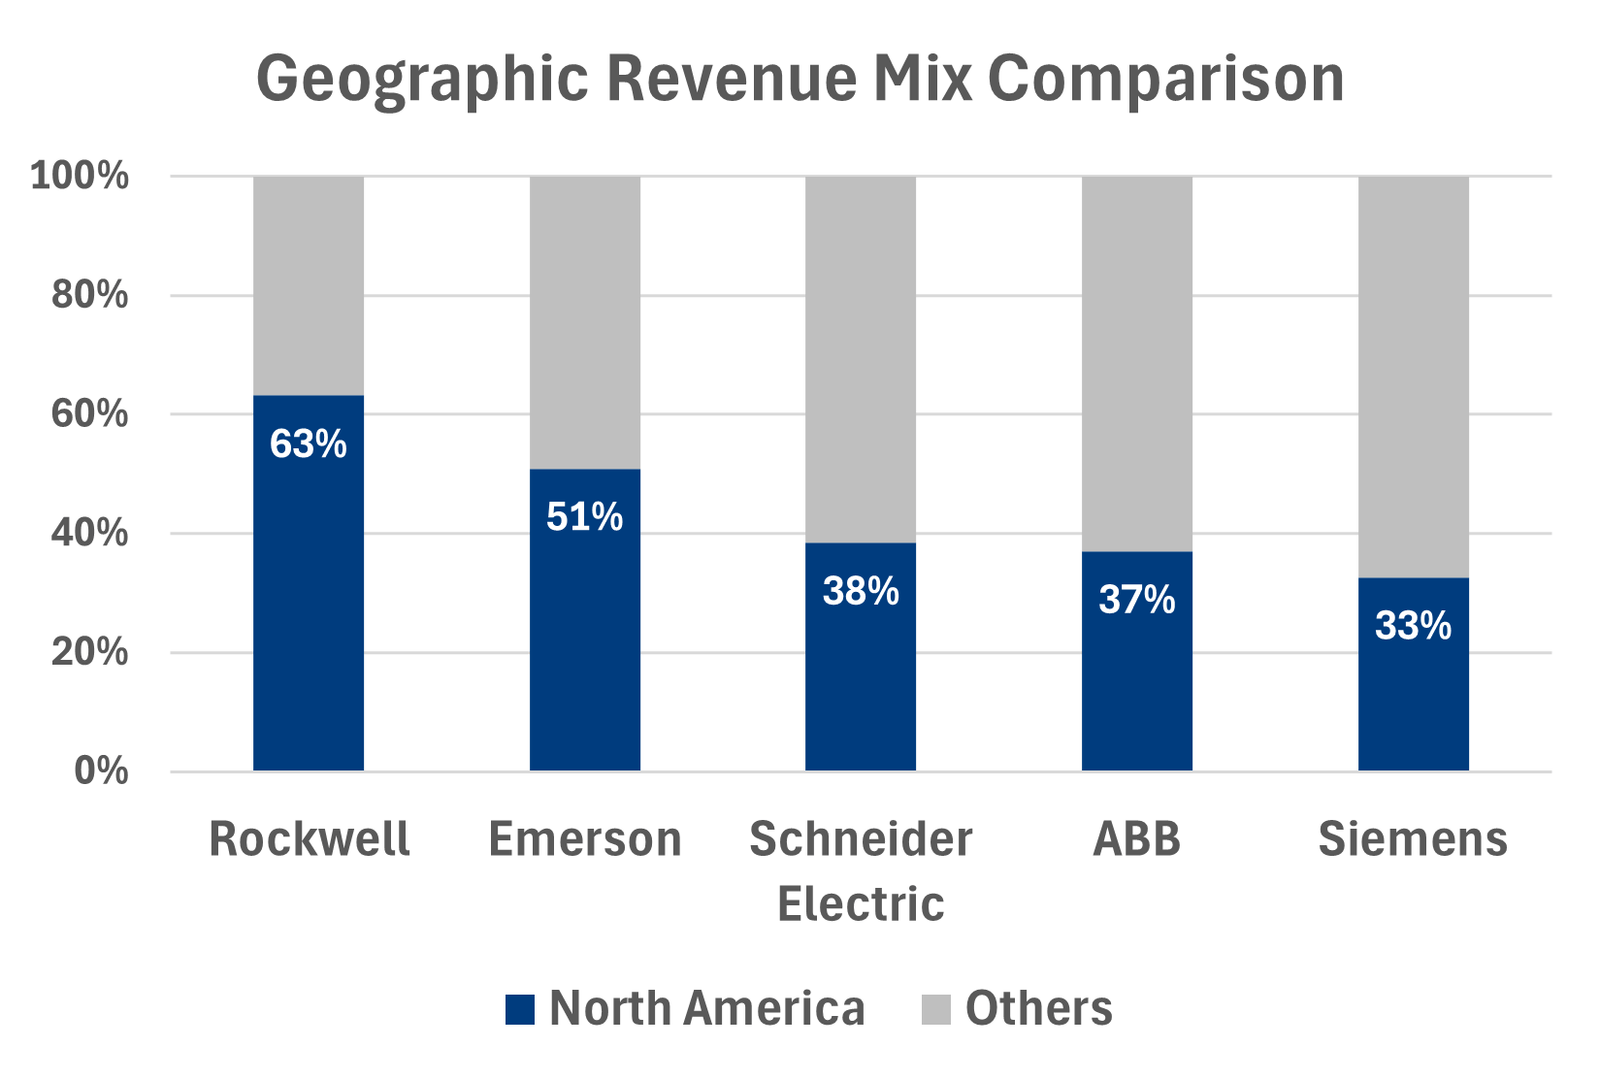
Rockwell Automation is best positioned as a North America-centric factory automation specialist within a peer group that includes broader global platforms such as Siemens, Schneider Electric, ABB and Emerson. Its competitive relevance is not primarily a function of global scale, but rather of its dense installed base, deep channel reach and ability to deliver an increasingly integrated automation stack spanning control hardware, software and lifecycle services. This positioning is particularly important in the current U.S. industrial backdrop: Rockwell generated approximately 63% of FY2025 revenue in North America, making it materially more leveraged to U.S. manufacturing investment than more geographically diversified peers. Schneider Electric, by contrast, reported North America at 39% of Q3 2025 revenues, underscoring the comparatively higher regional concentration of Rockwell’s revenue base.
From a competitive standpoint, the peer set should be framed by business model rather than by size alone. Siemens and Schneider compete with Rockwell through broader and more globally diversified automation platforms, while Emerson is more heavily skewed toward process automation and therefore overlaps less directly with Rockwell’s factory-automation core. Rockwell’s differentiation lies in its ability to combine discrete automation hardware, control architecture, industrial software and service attachment in a single operating model, making it one of the few vendors able to offer a genuinely integrated proposition across the plant floor. This is strategically relevant because, in industrial automation, customer capture depends not only on product breadth but also on engineering familiarity, installed-base stickiness, local support and the ability to layer software and services on top of existing control infrastructure.
Rockwell’s positioning also appears favorable in the context of U.S. reshoring and reindustrialization. A greater share of domestic manufacturing build-out should mechanically benefit vendors with stronger North American commercial density, established distributor relationships and a large installed base in local factories. In that respect, Rockwell’s business is arguably more directly exposed to incremental U.S. automation demand than that of broader global peers.
This is particularly relevant because Rockwell’s end-market exposure is skewed toward machinery and equipment and food & beverage, discrete and hybrid markets that are generally less directly tied to commodity-price swings than the more process-heavy exposure of peers such as Emerson.
As a result, Rockwell combines a high sensitivity to U.S. manufacturing capex with a somewhat more balanced end-market mix than automation vendors that are more exposed to oil, gas or other commodity-linked process verticals.
From an investment perspective, Rockwell should therefore not be viewed simply as a smaller version of a global automation conglomerate. Rather, it should be seen as a higher-purity play on North American factory automation, with greater direct leverage to U.S. industrial capex, reshoring-related plant investment and the progressive monetization of software and services on top of a large installed hardware base. The trade-off is lower geographic diversification relative to the largest European peers, but that same concentration is also what makes the company particularly well placed to intercept incremental automation demand if U.S. manufacturing capacity continues to expand.
Recent Share Performance
Rockwell Automation’s share-price performance in 2025 can be best understood as a progressive re-rating from a depressed starting point rather than as a simple reflection of top-line acceleration. The move is particularly noteworthy because it unfolded against a volatile macro backdrop, marked by tariff-related market turbulence following Trump’s April 2 “Liberation Day” announcements and renewed geopolitical stress in the Middle East during June 2025. Against that backdrop, the stock’s roughly 44% appreciation over the period ending in 2025 (materially ahead of the Industrial Select Sector SPDR ETF (XLI), which rose roughly 16.7% over the same period), suggests that investors increasingly focused on improving earnings quality, stronger execution and Rockwell’s strategic leverage to a reshoring-driven U.S. industrial cycle.
The first important turning point came with fiscal Q1 2025 results, when Rockwell delivered adjusted EPS above expectations and the stock reacted sharply higher, helped by better profitability and strength in lifecycle-related services despite still-soft sales. The second leg of the re-rating followed in May, when the company raised the lower end of its full-year adjusted EPS guidance, supported by cost savings and resilient demand for automation services. By the fourth quarter, the market had become increasingly confident that Rockwell was no longer merely navigating a cyclical slowdown, but was also demonstrating better earnings quality through structural productivity actions, margin expansion and improving demand trends. That shift culminated in the November 2025 results, when Rockwell beat on both revenue and earnings and introduced a constructive FY2026 outlook, prompting another positive share-price reaction.
Fundamentally, this re-rating was supported by a clear improvement in financial performance through FY2025. For the full year, Rockwell reported sales of $8.34 billion, up 1% year-on-year, while total segment operating margin expanded to 20.4% from 19.3%, and adjusted EPS increased 7% to $10.53. Importantly, the market’s reaction was driven less by absolute revenue growth and more by the improvement in margin structure and earnings conversion, which suggested that management’s productivity and cost actions were gaining traction even before a full cyclical recovery had taken hold.
The strongest confirmation came in Q4 FY2025, when Rockwell reported revenue of $2.32 billion (+14% YoY), segment operating margin of 22.5%, and adjusted EPS of $3.34, all above market expectations. Management explicitly linked the performance to higher sales volume, price realization, favorable mix and strong productivity execution. This was particularly important for the stock, because it reinforced the idea that Rockwell could deliver earnings upside not only through a demand recovery, but also through self-help measures and a more favorable mix between hardware, software and services.
From a sector perspective, the stock also benefited from a broader shift in investor expectations around U.S. industrial capex in 2025. The Trump administration’s return to office in January 2025 brought tariffs and domestic industrial policy back to the center of the market narrative. For the automation space, this mattered because any increase in reshoring, greenfield investment or domestic capacity build-out tends to translate into incremental demand for controls, drives, motion systems, software and plant-level digitalization. By early 2026, Reuters was explicitly describing Rockwell as a beneficiary of U.S. manufacturing reshoring and increased automation investment, suggesting that this theme had become part of the market’s valuation framework.
Recent Financial Performance
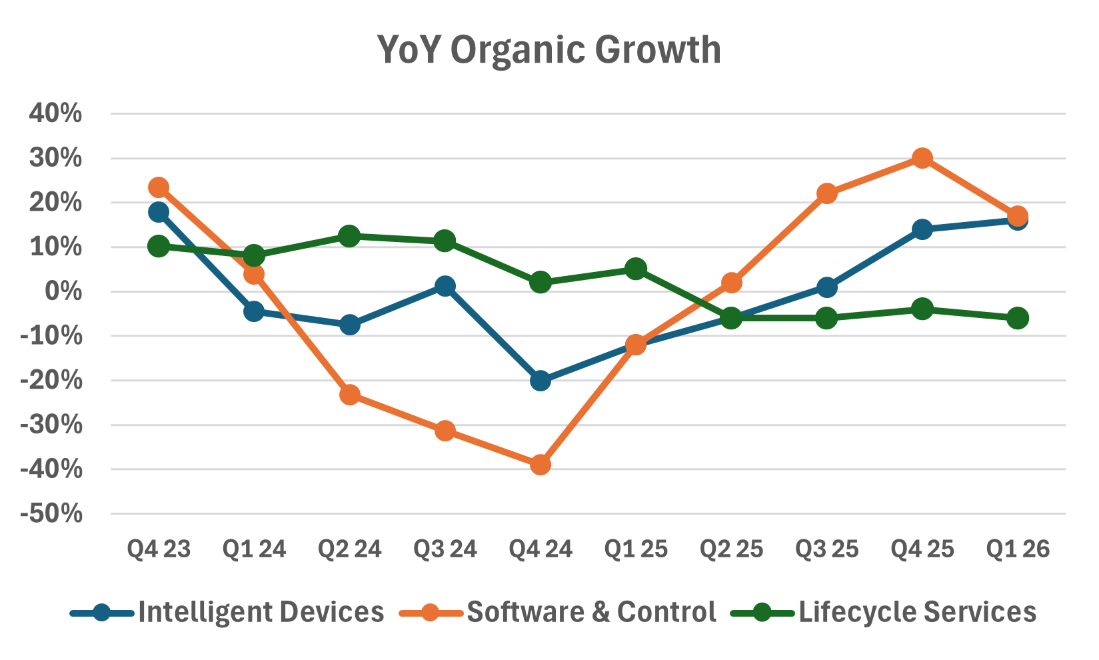
Rockwell’s most recent financial performance confirms that the improvement in investor sentiment has been supported by a tangible step-up in operating execution. In Q1 FY26, the company reported sales of $2.11bn, up 12% year-on-year, with organic growth of 10%, while segment operating margin expanded by 360bps to 20.7% and adjusted EPS rose 49% to $2.75. The improvement was driven by a combination of higher volume, positive price/cost, favorable mix and continued productivity actions, indicating that earnings growth is being supported not only by a cyclical recovery in demand but also by stronger operating discipline. At the segment level, the strongest contribution came from Software & Control, where revenue increased to $629m and operating margin expanded to 31.2%, while Intelligent Devices also delivered robust growth, with revenue up to $953m and margin improving to 17.3%. By contrast, Lifecycle Services remained softer on the top line, with revenue down to $523m, although margin still improved to 14.1% thanks to productivity and project execution. Overall, the latest quarter suggests that Rockwell is exiting the weaker 2024 backdrop with a better mix, stronger incremental profitability and sufficient momentum for management to reaffirm its FY26 sales outlook and raise the midpoint of adjusted EPS guidance.
Financial Risk
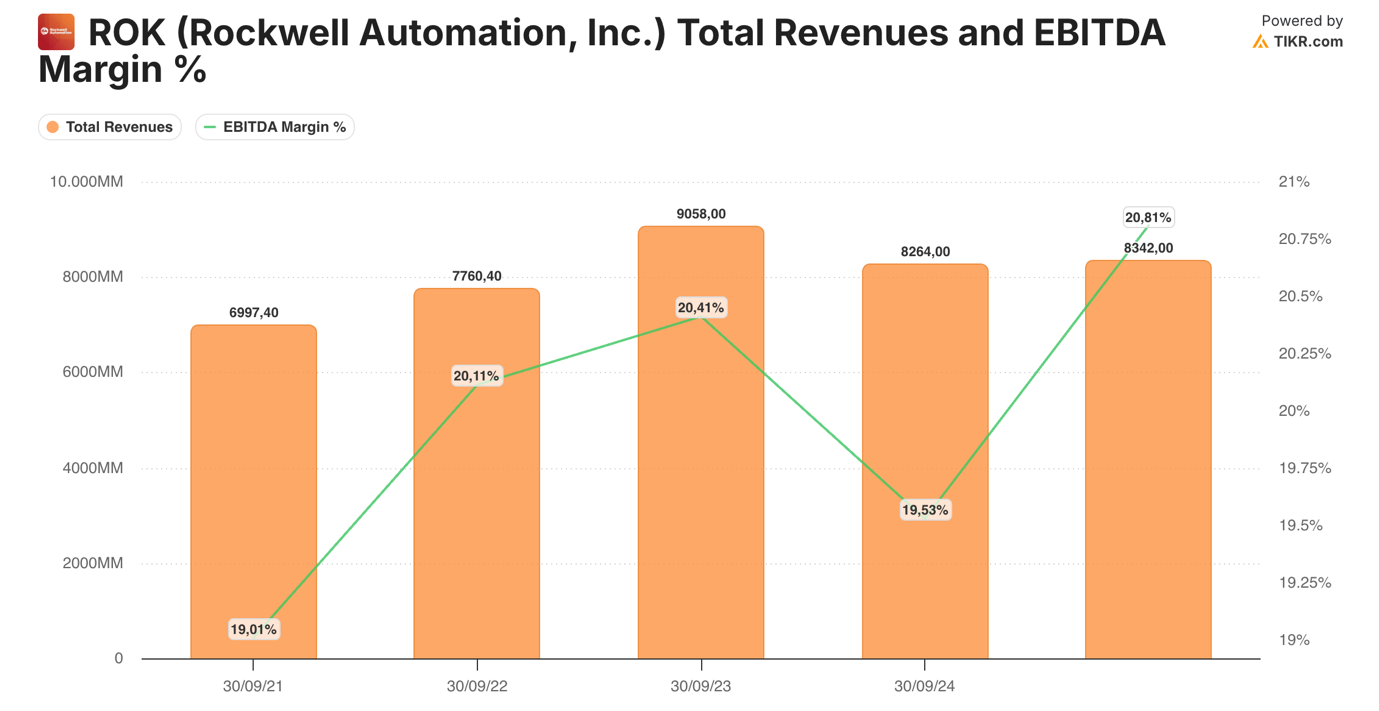
Rockwell Automation enters the current cycle as a mid-sized industrial technology company with a relatively solid financial profile. Over FY2021–FY2025, revenue increased from approximately $7.0bn to $8.3bn, implying a 4.5% CAGR, while EBITDA rose from roughly $1.33bn to $1.74bn, implying a faster 6.9% CAGR, with EBITDA margin expanding from 19.0% to 20.8% despite the demand normalization experienced in 2024. Importantly, that medium-term profile was followed by a clear reacceleration in Q1 FY26, when the company reported sales growth of 12% year-on-year and organic growth of 10%, confirming that the earnings base entering fiscal 2026 was already improving again. This matters from a credit-risk perspective because it shows that the company has been able to preserve and gradually improve profitability even through a less supportive automation environment, rather than relying on top-line growth alone.
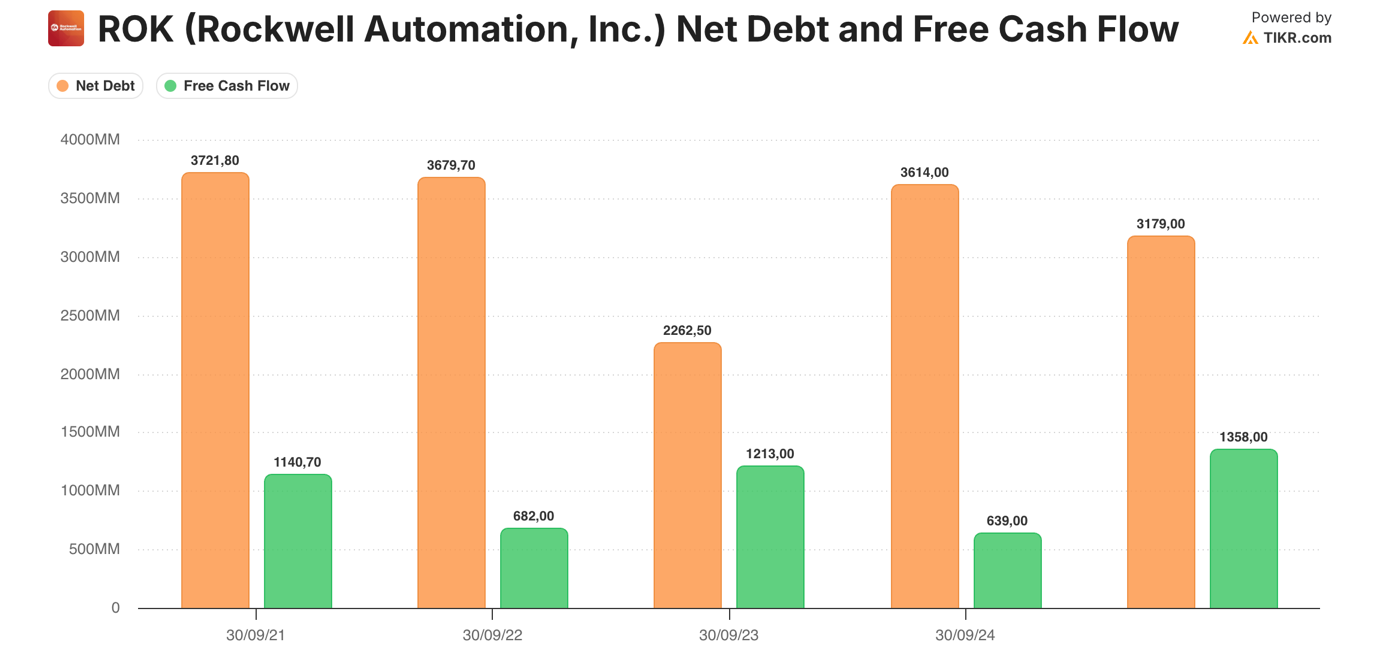
From a balance-sheet standpoint, Rockwell does carry a meaningful amount of debt, but leverage appears manageable and has improved versus earlier periods. Net debt stood at approximately $3.72bn in FY2021, declined materially to $2.26bn in FY2023, rose again to $3.61bn in FY2024, and then improved to around $3.18bn in FY2025. Rockwell is not operating with a large surplus cash buffer. As a result, the balance sheet’s resilience depends primarily on the company’s ability to keep converting EBITDA into free cash flow, rather than on excess liquidity.
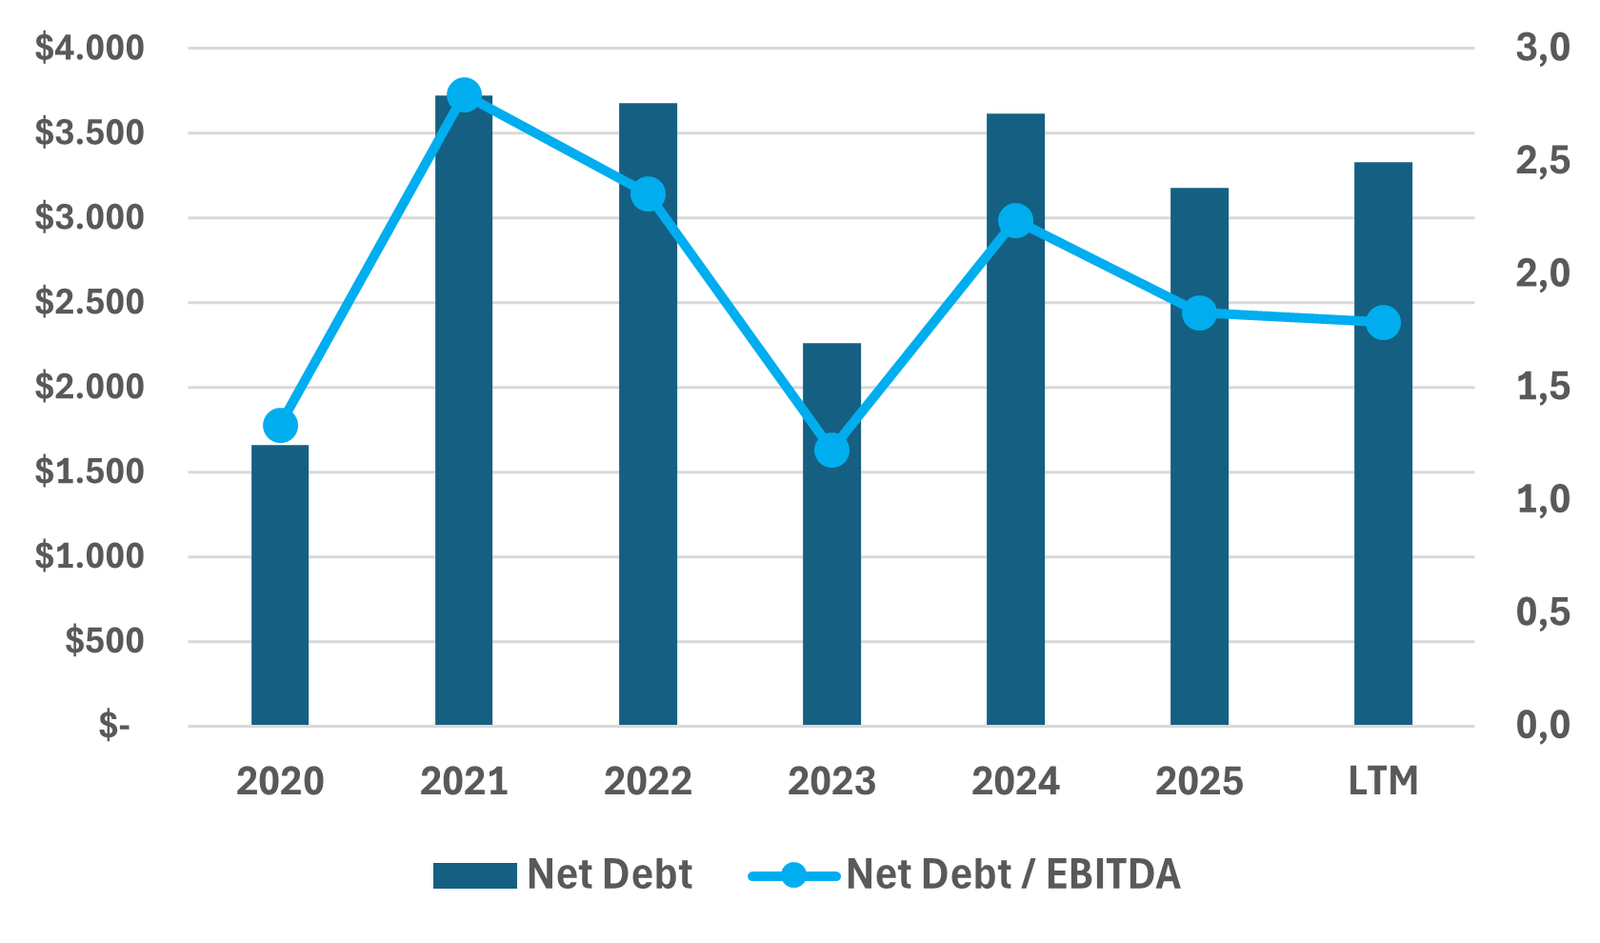
On the same timeline, Net Debt / EBITDA fell from 2.80x in FY2021 to 2.36x in FY2022, 1.22x in FY2023, 2.24x in FY2024, and 1.83x in FY2025. This interpretation is also broadly consistent with S&P Global Ratings’ July 2024 downgrade to A- from A, which was driven not by operating weakness, but by a more aggressive financial policy and the expectation that leverage could periodically move toward 3x.
The movement in leverage over this period is best understood through the interaction between M&A, free cash flow generation, working-capital swings and shareholder returns.
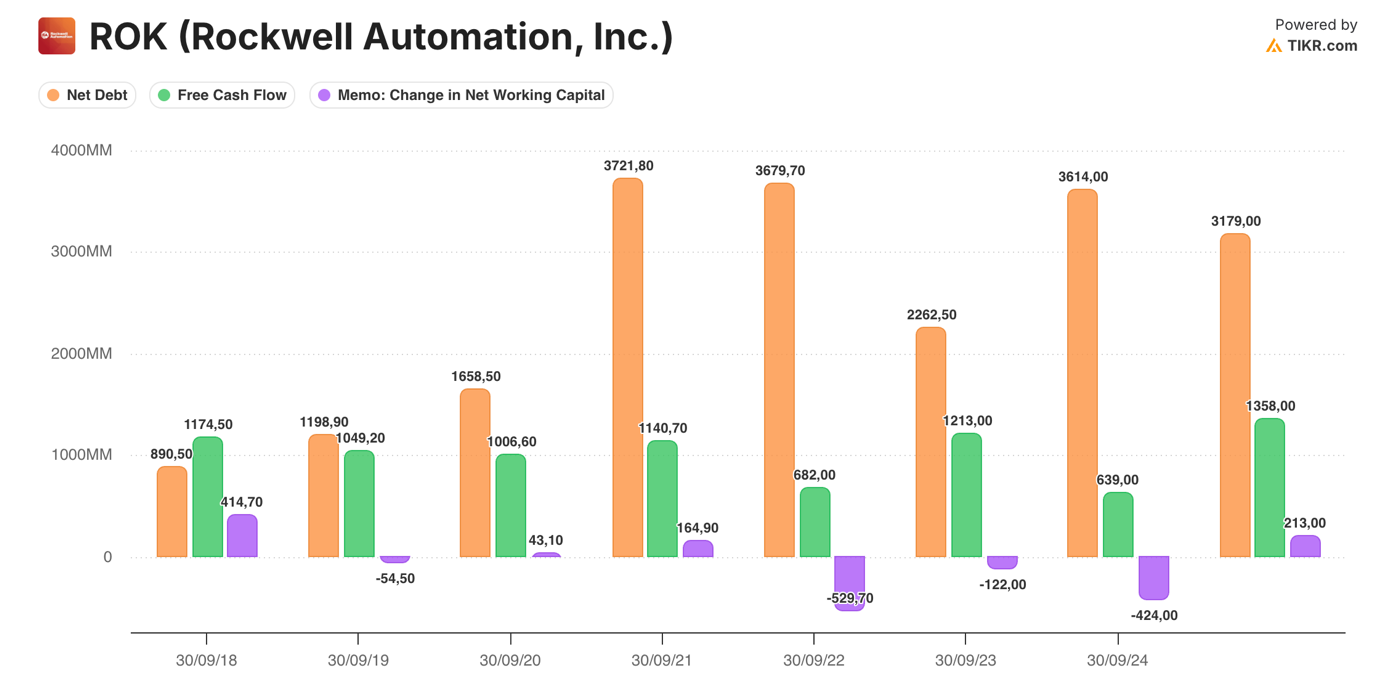
The sharp increase in FY2021 was primarily linked to the Plex acquisition, which lifted leverage materially and pushed debt metrics close to the upper end of Rockwell’s recent range. Net debt then declined in FY2022 and especially FY2023 as the company converted a stronger earnings base into solid free cash flow.
By contrast, the re-leveraging in FY2024 was not driven by a liquidity shock, but by weaker pretax income, lower free cash flow generation and the continuation of a shareholder-friendly capital-allocation policy. In its FY2024 call, management stated explicitly that free cash flow had decreased by $575 million versus FY2023 and that this decline was driven by lower pretax income, while the company still deployed approximately $1.2 billion toward dividends and share repurchases during the year. The subsequent improvement in FY2025 was therefore consistent with a recovery in free cash flow rather than with any major change in financial policy. In other words, leverage has not followed a straight deleveraging path, but it has remained within a controllable range, with the FY2024 re-leveraging subsequently reversing in FY2025.
The more important point, however, is that Rockwell is structurally a free-cash-flow-generative business. Over FY2021–FY2025, operating cash flow ranged between roughly $0.82bn and $1.54bn, while annual capital expenditure remained relatively modest at approximately $120m–225m, confirming that the business is not highly capital intensive.
FCF Conversion
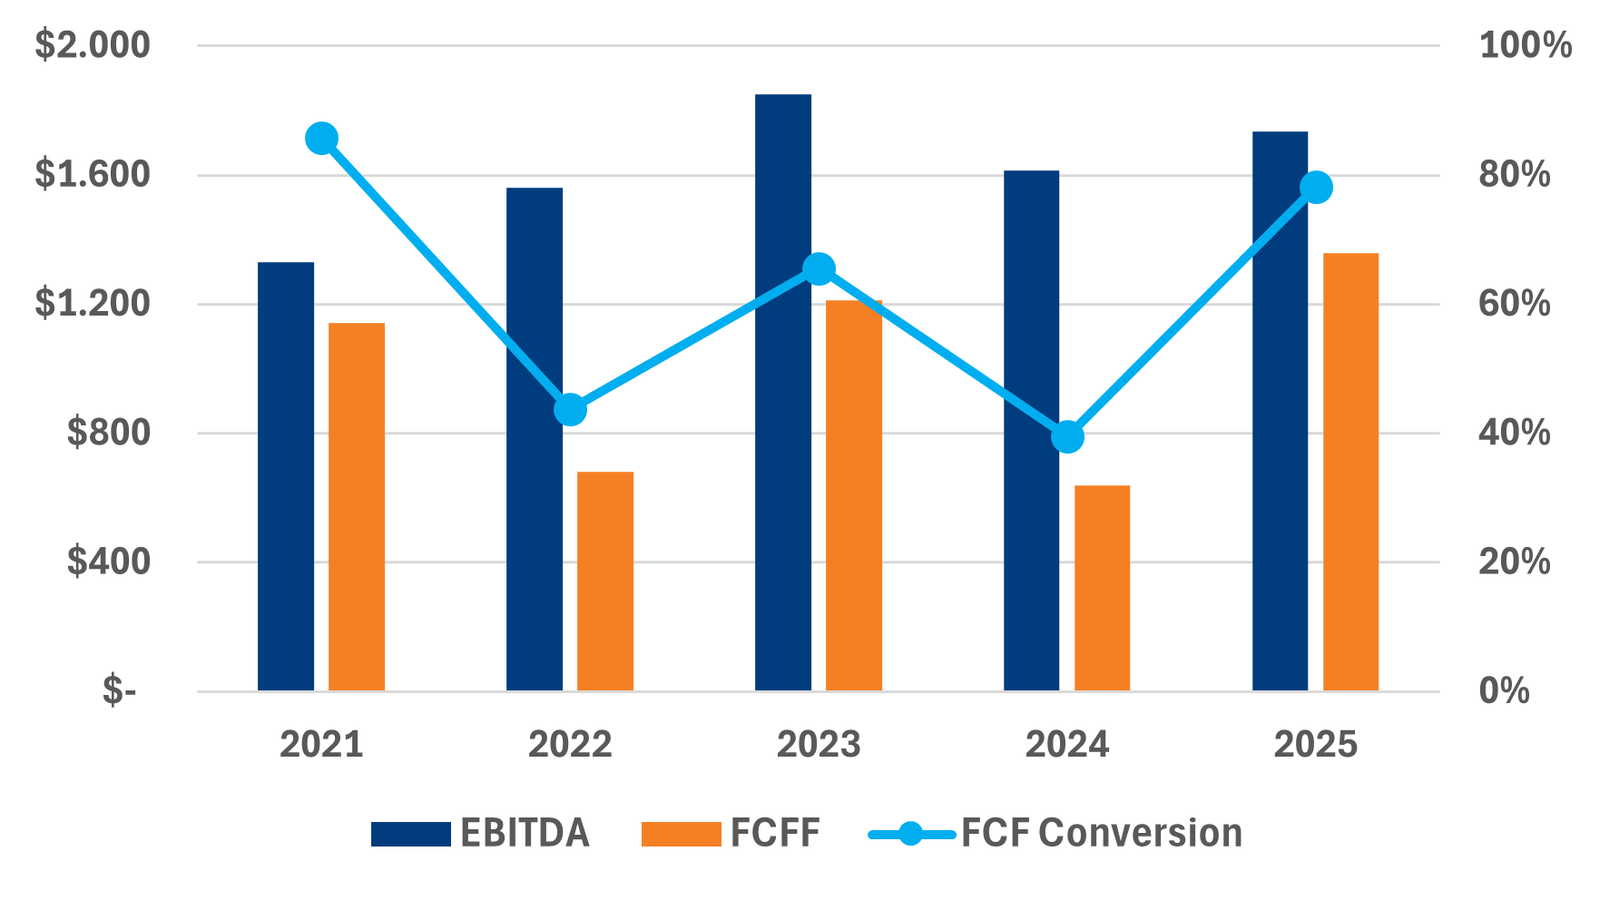
As a result, free cash flow remained positive in every year of the period. On that basis, average FCF conversion (FCF / EBITDA) over the last five fiscal years was approximately 62%–63%, which is solid for an industrial automation business, even if not perfectly linear year by year. On a more recent three-year basis, conversion remained broadly similar at approximately 61%–62%, suggesting that underlying cash generation has remained resilient despite a more volatile working-capital environment. The main reason for that variability appears to be working-capital absorption rather than structural weakness in the operating model.
In fact, the cash conversion cycle worsened from roughly 96 days in FY2023 to 114 days in FY2024 and remained elevated at around 113 days in FY2025, indicating that receivables, payables and inventory timing can still introduce volatility into annual cash generation.
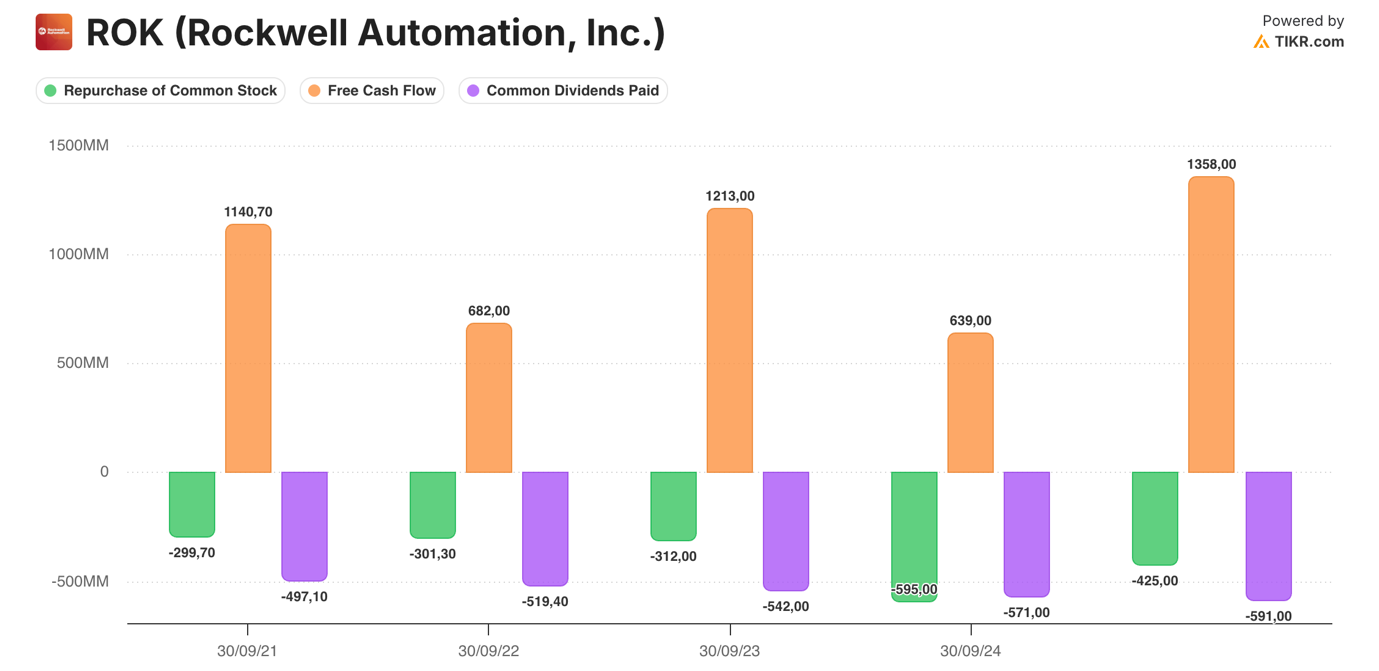
In terms of capital allocation, Rockwell’s free cash flow has been used primarily to support shareholder returns, with dividends consistently increasing from approximately $497m in FY2021 to $591m in FY2025, while buybacks ranged between roughly $300m and $595m per year before moderating to around $425m in FY2025.
Debt management has been more opportunistic than formulaic: the company issued debt in FY2021, FY2022, FY2024 and FY2025, while using stronger cash-generation years such as FY2023 and FY2025 to repay larger portions of debt. This suggests that management is not pursuing aggressive balance-sheet deleveraging as a primary objective, but rather operating with a capital allocation framework that balances dividends, repurchases and periodic debt reduction. This is an important nuance for the risk assessment: Rockwell has the capacity to delever more quickly, but management has consistently prioritized a balanced capital-allocation framework over rapid debt reduction, implying that leverage is being managed rather than aggressively minimized.
Rockwell’s financial risk profile appears contained rather than negligible. The company is not under-levered, but neither does it appear balance-sheet constrained. Leverage remains moderate, with Net Debt / EBITDA at 1.83x in FY2025, while EBITDA interest coverage remained above 10x in both FY2024 and FY2025 (approximately 10.5x and 11.1x, respectively). CapEx requirements are also modest, averaging roughly 2% of sales over the last five fiscal years, and the business continues to generate recurring free cash flow through the cycle.
However, the key area to monitor is less the absolute level of indebtedness than the company’s ability to sustain solid cash conversion while maintaining a shareholder-friendly capital-allocation framework. In a weaker demand environment, financial risk would become more relevant if working-capital absorption remained elevated while buybacks, dividends or debt-funded M&A limited the pace of deleveraging. In that sense, Rockwell’s financial risk is best described as manageable, but increasingly policy-dependent rather than purely balance-sheet constrained.
Investment Thesis
Rockwell Automation’s investment case is no longer one of simple multiple re-rating from depressed levels, but rather one of earnings acceleration supported by improving mix, stronger operating leverage and a more constructive U.S. industrial backdrop. The stock currently trades at approximately 21.9x NTM EV/EBITDA and 30.4x NTM P/E, both above their respective three-year averages of roughly 19.9x and 26.7x, while the 3.1% NTM levered FCF yield remains below its historical mean. This suggests that a meaningful portion of the rerating has already taken place.
That said, current valuation is broadly in line with the rerated range seen over the last twelve months, implying that the market is no longer paying a fresh premium so much as sustaining the valuation uplift already earned through better execution and a stronger forward earnings profile.
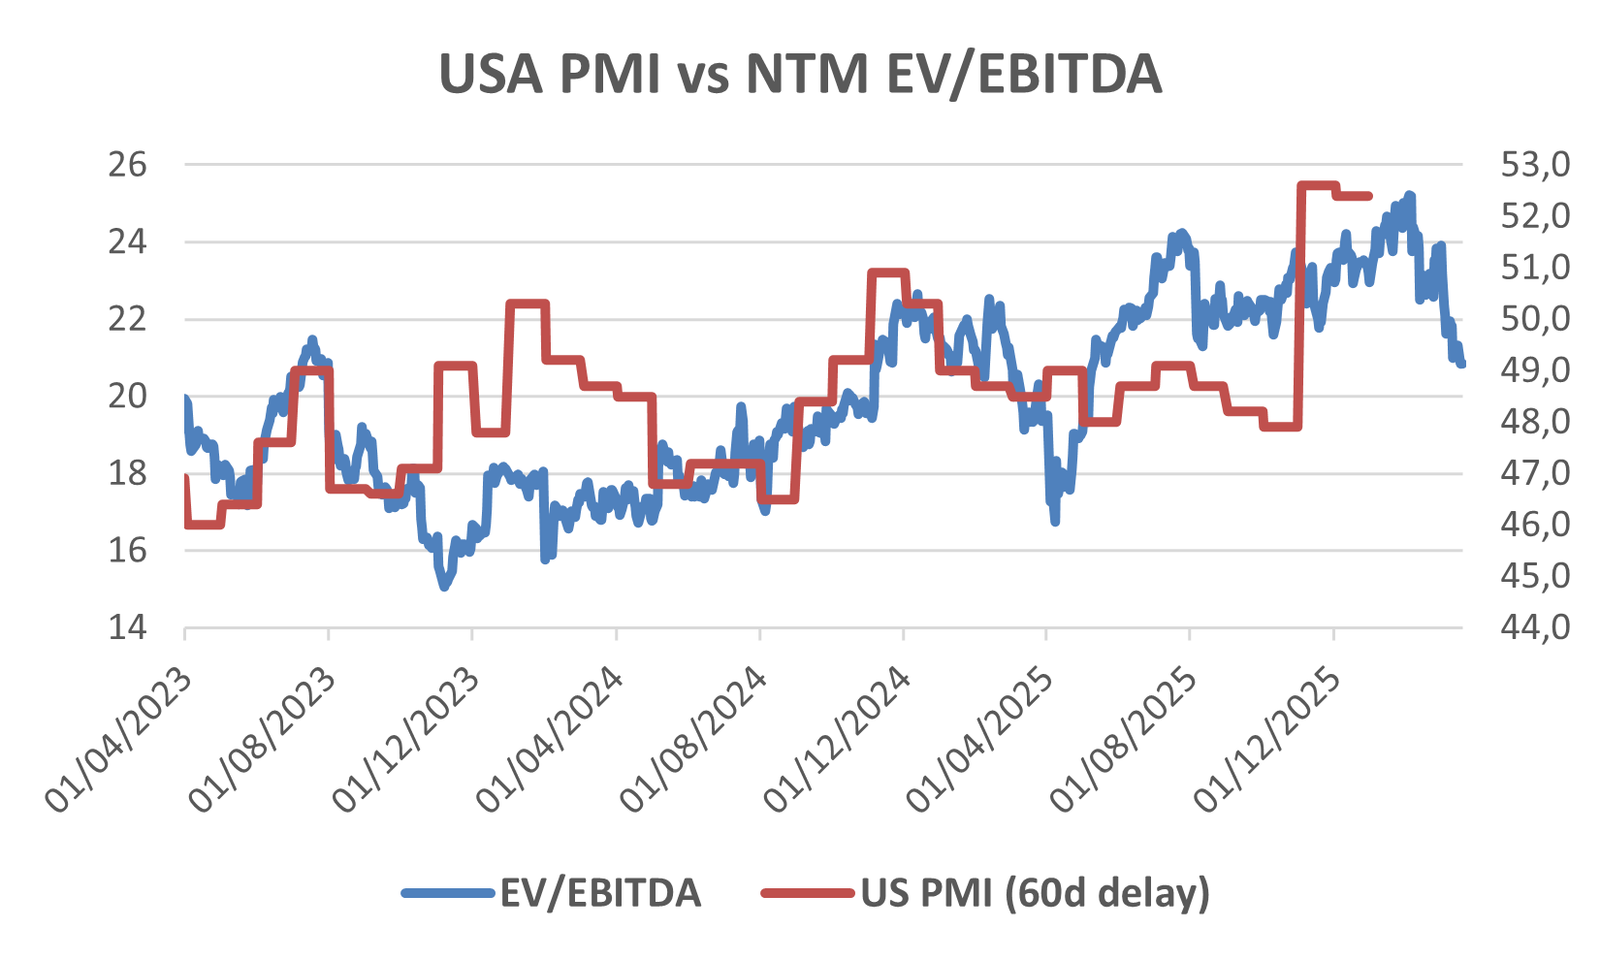
The PMI linkage is important because Rockwell’s valuation has historically shown a meaningful relationship with the direction of U.S. manufacturing sentiment. In particular, investors seem to anticipate the next two monthly readings of the PMI. For this reason, Rockwell’s multiples have declined meaningfully over the last month, as investors anticipate a softer PMI print as higher input prices and geopolitical uncertainty continue to weigh on industrial confidence.
Our base assumption is that it remains in the Trump administration’s political and economic interest to keep the current conflict as short as possible, both to limit spillover effects on the U.S. economy and to avoid an unnecessary hit to business sentiment ahead of the 2026 midterm cycle, with the general election scheduled for November 3, 2026. A resolution of the conflict would ease investor’s concerns about manufacturing companies and lift industrial confidence, causing a rerating in Rockwell’s price.
The U.S. economy is more resilient than many regions to elevated oil prices given its large domestic energy base, but a prolonged energy shock would still risk undermining confidence, inflation expectations and industrial activity. This is reflected in a negative correlation between oil prices and Rockwell’s multiples, which strengthens when price per barrel approaches $85/90.
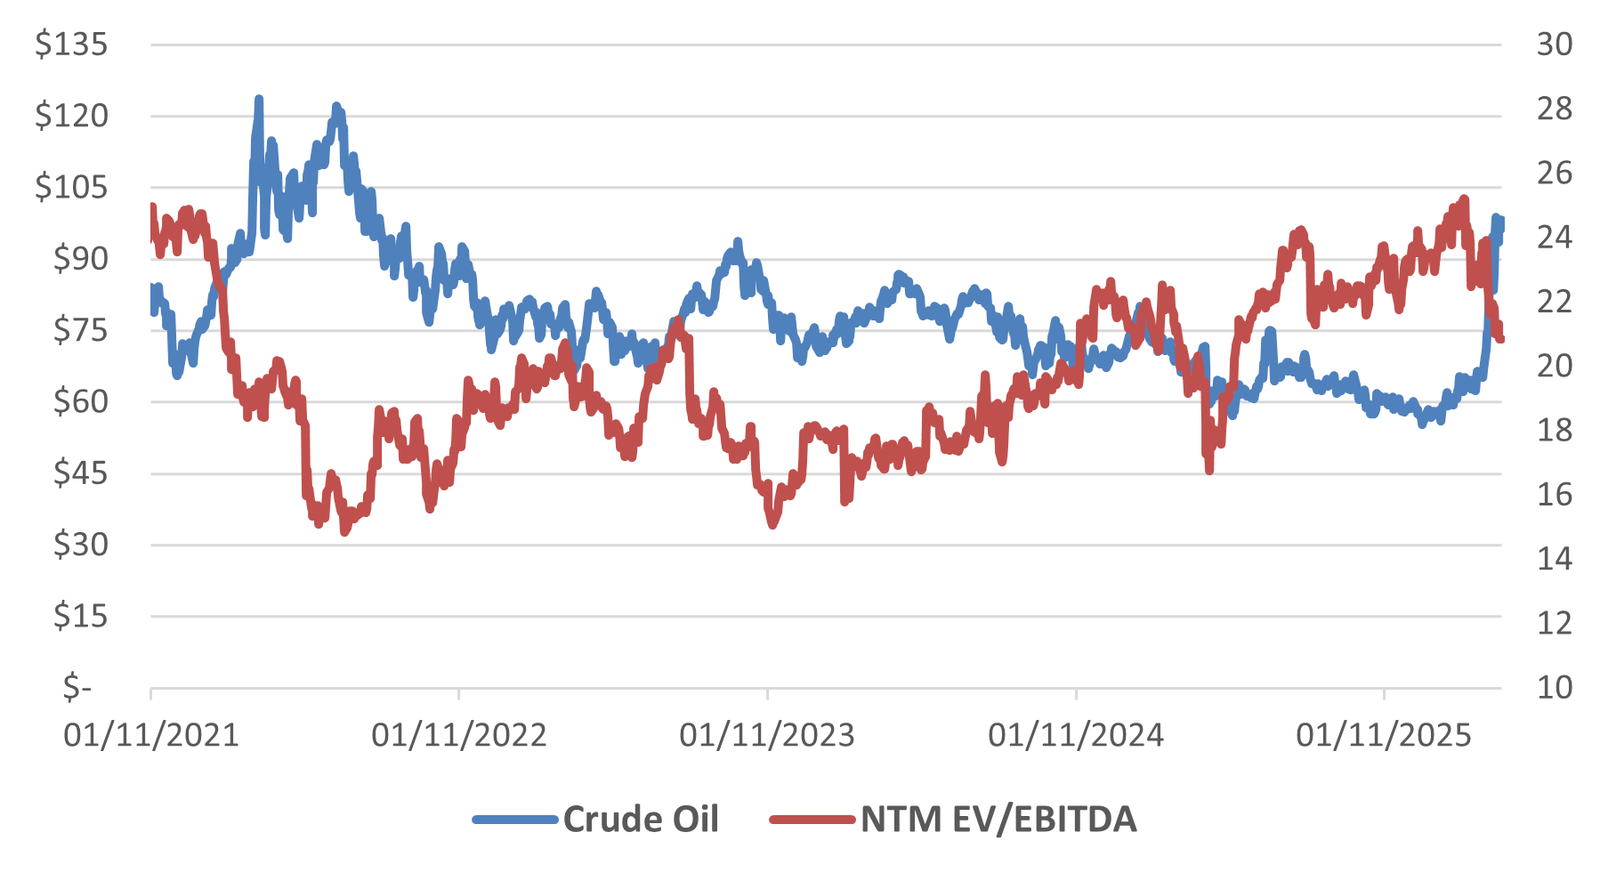
In that context, a weaker PMI print would be better read as a near-term macro valuation headwind than as a structural break in the automation thesis. The more important issue for the stock remains whether temporary macro softness interrupts order timing, or whether it merely delays a broader reshoring- and productivity-driven recovery.
The key question from here is therefore whether the 2026–2027 earnings ramp can justify those multiples. On that front, the contrast versus the last two years is meaningful.
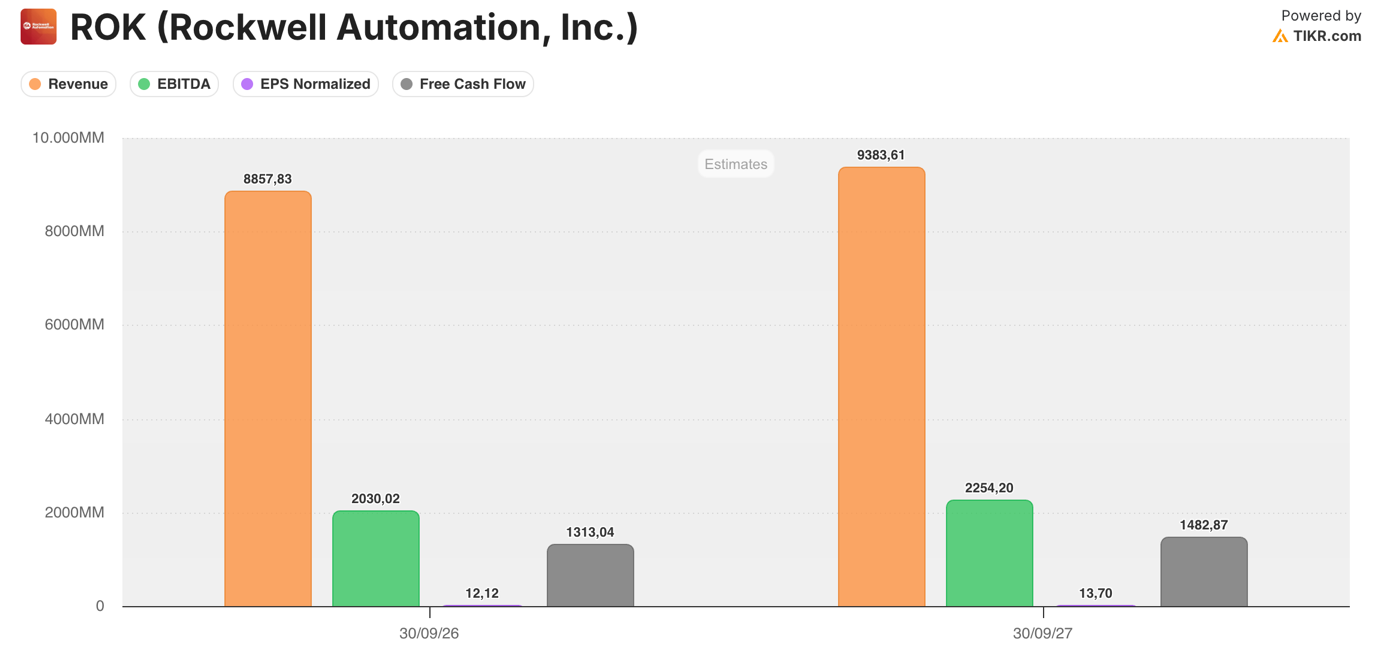
After weak growth in FY2024 and only modest recovery in FY2025, consensus now expects revenue growth of 6.2% in FY26 and 5.9% in FY27, EBITDA growth of 13.6% and 11.0%, and normalized EPS growth of 15.1% and 13.1%, with EBITDA margin rising from 21.4% in FY25 to 22.9% in FY26 and 24.0% in FY27.
In other words, the market is no longer valuing the company on the weak 2024–2025 setup, but on a materially improved 2026–2027 earnings trajectory. If those estimates prove broadly correct, the current premium to long-term historical averages appears more understandable, particularly given the higher quality of growth implied by stronger software contribution, better margin structure and continued productivity gains.
The latest earnings call reinforces this interpretation, but with an important nuance: management’s tone should be described as cautiously constructive rather than outright bullish.
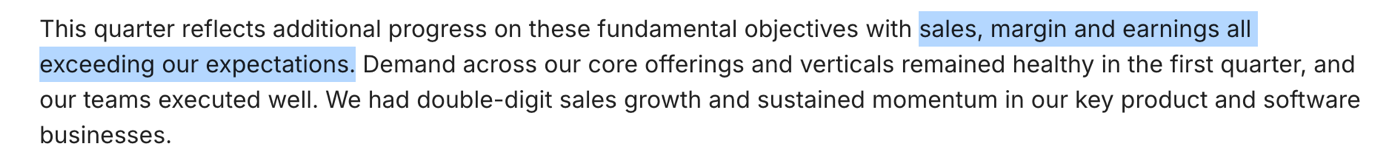
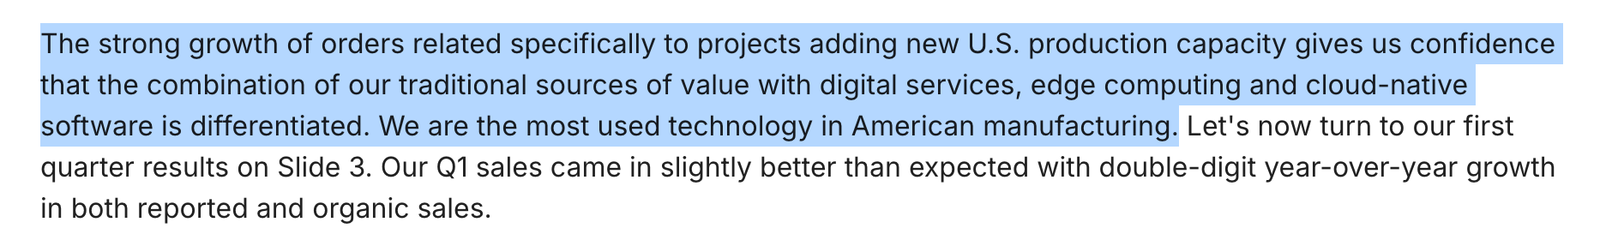
On the positive side, Rockwell highlighted that sales, margin and earnings all exceeded expectations, while emphasizing strong momentum in Logix, Software & Control, and orders linked to new U.S. production capacity.
Management also sounded increasingly confident on margin expansion, supported by productivity actions, favorable mix and sustained software adoption.
At the same time, however, Blake Moret repeatedly stressed that large CapEx projects remain uneven, and that the company has not yet seen the broad-based release of orders needed to move toward the upper end of full-year guidance.
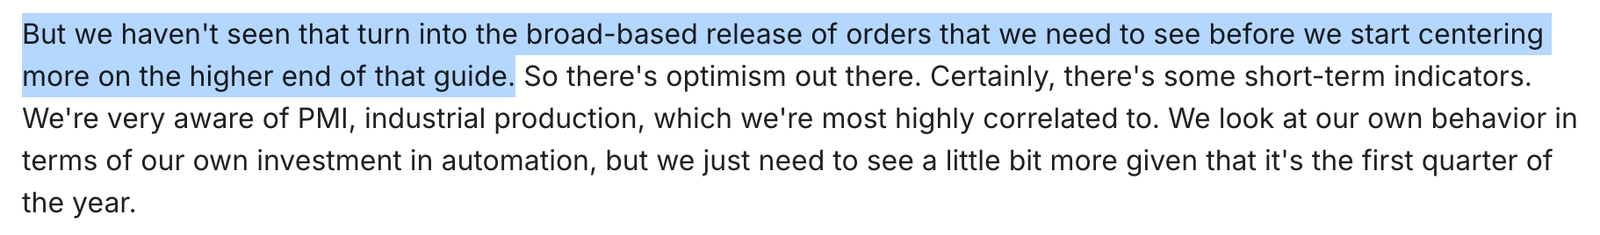
This makes the setup attractive, but not risk-free: the company is clearly winning in the right pockets of demand, yet the next leg of upside likely depends on those pockets broadening into a more generalized recovery in industrial orders.
A further nuance to the thesis is that tariff uncertainty should not be viewed only as a headwind. In the near term, tariffs and broader trade-policy volatility can clearly delay project timing, raise input-cost uncertainty and keep customers cautious on large releases. Over a slightly longer horizon, however, the same policy backdrop can strengthen the structural case for automation.
If reshoring and domestic capacity expansion raise the cost base of manufacturing in the United States, the economic incentive to automate labor-intensive, energy-sensitive and quality-critical processes becomes even stronger. In that sense, tariff uncertainty may weigh on timing, but the higher-cost manufacturing footprint that follows reshoring should be more than offsetting for automation intensity. For Rockwell specifically, that matters because it combines high exposure to North American manufacturing with an offering increasingly geared toward software, controls and productivity-enhancing plant modernization.
A further support to the thesis comes from the balance sheet and cash-generation profile. While Rockwell is unlikely to become a net-cash company in the near term, consensus FCF of roughly $1.3bn in FY26 and $1.5bn in FY27, combined with rising EBITDA, should still support a gradual compression in leverage over the next 12–24 months. The relevant equity implication is not the elimination of debt, but rather greater financial flexibility and a lower Net Debt / EBITDA ratio, especially if management keeps capital allocation broadly consistent with recent history.
This matters because it adds a second layer of support to the story: beyond earnings growth, the company should also benefit from a progressively cleaner financial profile as cash flow remains solid and margin quality improves. On valuation, therefore, the stock should not be framed as cheap, but rather as a premium industrial automation name that still has upside if execution continues to validate the medium-term earnings path.
That said, a modest haircut to current expectations appears reasonable in the near term: after a month of war-related disruption and potentially another month of adjustment, normalized EPS could plausibly land somewhat below current consensus, with $13.30 representing a credible working assumption rather than the full $13.70 currently embedded in FY27 estimates.
Even on that more conservative base, if the conflict fades and macro conditions stabilize, it is reasonable to expect the multiple to move back toward roughly 32x–33x P/E, which would still support an indicative valuation range of approximately $426–439 per share. In that framework, the stock still offers upside, but the case rests less on flawless delivery versus consensus and more on the combination of resilient earnings power, improving balance-sheet quality and the market’s willingness to sustain a premium multiple once geopolitical pressure begins to normalize.